Oracle Critical Patch Updates – some statistics
In January I started some posts on the Oracle Critical Patch Updates (CPU) on my German blog (www.markusdba.de). Here’s the translated version of my July post:
In January 2018 I started publishing some statistics and graphics about Oracle’s Critical Patch Updates in my blog. Yesterday Oracle released the July patches and so it’s time for the July update.
Critically, of course, these statistics are useless. The pure numbers say nothing about the criticality of the errors; a single vulnerability that allows remote database access without a password is certainly much more serious than a gap that only exists under certain conditions for a few operating systems and that can be corrected, for example, by changing parameters.
Overall number of security fixes in the Critical Patch Updates
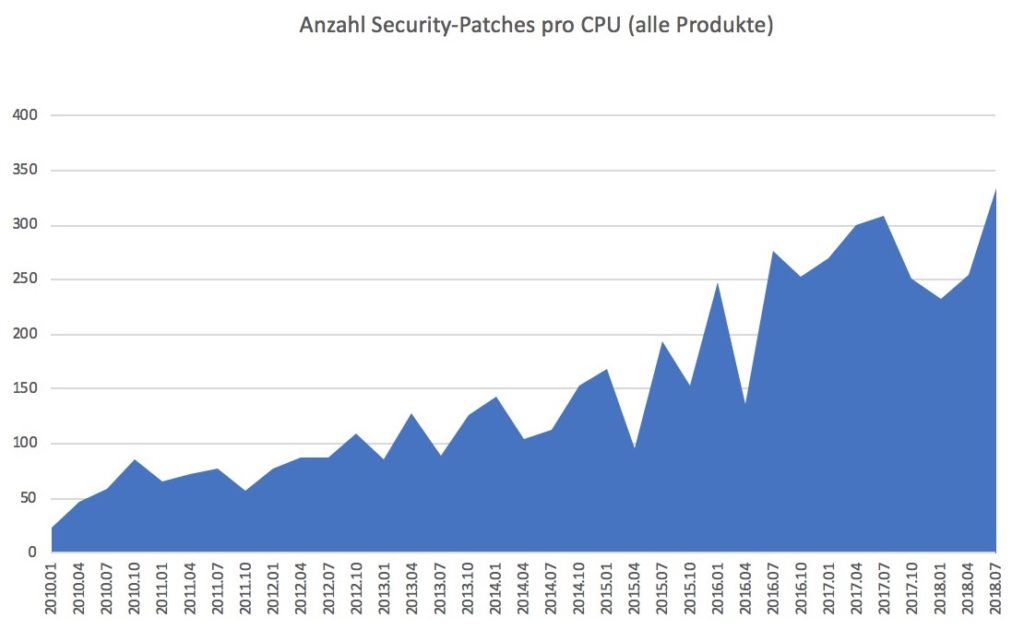
After exceeding the magical number of “300” for the first time a year ago, a new all-time high has now been achieved with 334 patches.
Of course this is a very high number of patches, but the patches are spread over 121 products. This reduces the arithmetic average “number of patches per affected product”:
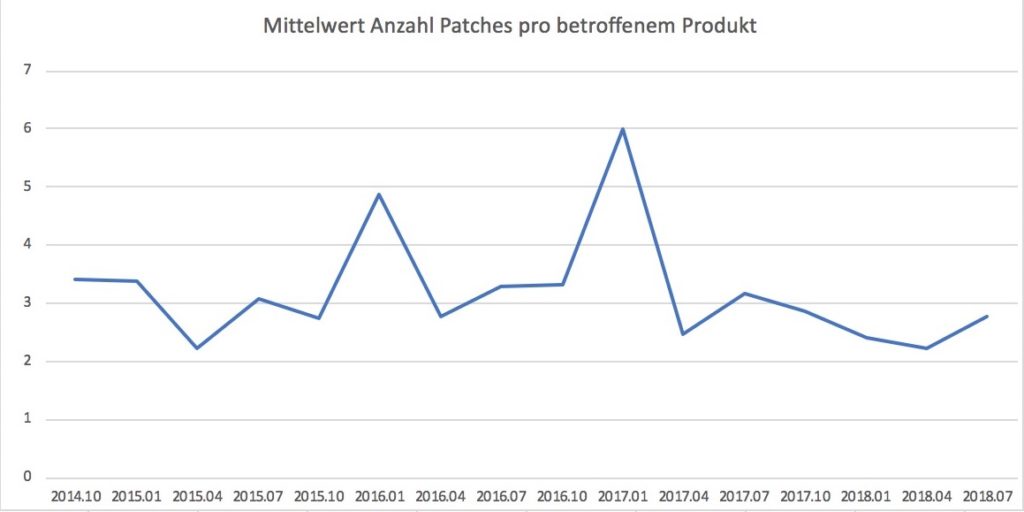
So there are – on average – about 3 patches per affected product. According to Oracle, only 3 security issues in the database will be fixed this time; the database is a kind of “typical average product”:
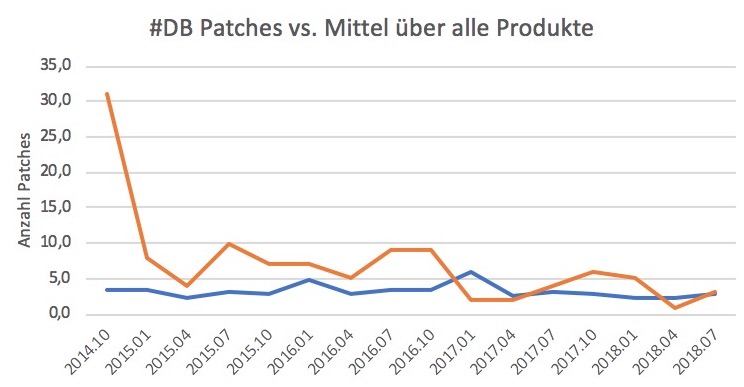
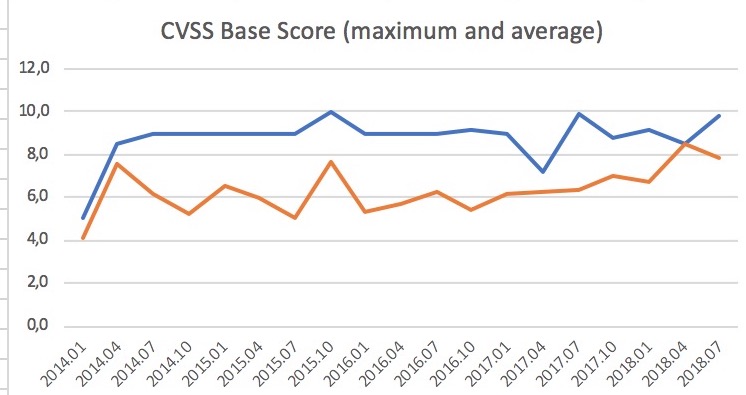
However, one should not be too happy about the small number of database fixes, because the CVSS scores for the database patches remain constantly at a quite high level:
Overview of the critical patch updates since 2010
| date | #Security Patches | change to previous CPU | #products | #patches/#products | #security patches for database | DB – max CVSS score | DB – avg CVSS score |
| 2010.01 | 24 | until 7/2014 the patches were listed differently so they cannot be compared with newer lists published by Oracle | 9 | ||||
| 2010.04 | 47 | 96% | 7 | ||||
| 2010.07 | 59 | 26% | 6 | ||||
| 2010.10 | 86 | 46% | 7 | ||||
| 2011.01 | 66 | -23% | 5 | ||||
| 2011.04 | 73 | 11% | 6 | ||||
| 2011.07 | 78 | 7% | 13 | ||||
| 2011.10 | 57 | -27% | 5 | ||||
| 2012.01 | 78 | 37% | 2 | ||||
| 2012.04 | 88 | 13% | 6 | ||||
| 2012.07 | 87 | -1% | 4 | ||||
| 2012.10 | 109 | 25% | 5 | ||||
| 2013.01 | 86 | -21% | 1 | ||||
| 2013.04 | 128 | 49% | 4 | ||||
| 2013.07 | 89 | -30% | 6 | ||||
| 2013.10 | 127 | 43% | 2 | ||||
| 2014.01 | 144 | 13% | 5 | 5,0 | 4,1 | ||
| 2014.04 | 104 | -28% | 2 | 8,5 | 7,6 | ||
| 2014.07 | 113 | 9% | 5 | 9,0 | 6,1 | ||
| 2014.10 | 154 | 36% | 45 | 3,4 | 31 | 9,0 | 5,2 |
| 2015.01 | 169 | 10% | 50 | 3,4 | 8 | 9,0 | 6,5 |
| 2015.04 | 96 | -43% | 43 | 2,2 | 4 | 9,0 | 6,0 |
| 2015.07 | 193 | 101% | 63 | 3,1 | 10 | 9,0 | 5,1 |
| 2015.10 | 153 | -21% | 56 | 2,7 | 7 | 10,0 | 7,7 |
| 2016.01 | 248 | 62% | 51 | 4,9 | 7 | 9,0 | 5,3 |
| 2016.04 | 136 | -45% | 49 | 2,8 | 5 | 9,0 | 5,7 |
| 2016.07 | 276 | 103% | 84 | 3,3 | 9 | 9,0 | 6,3 |
| 2016.10 | 253 | -8% | 76 | 3,3 | 9 | 9,1 | 5,4 |
| 2017.01 | 270 | 7% | 45 | 6,0 | 2 | 9,0 | 6,2 |
| 2017.04 | 300 | 11% | 121 | 2,5 | 2 | 7,2 | 6,3 |
| 2017.07 | 308 | 3% | 97 | 3,2 | 4 | 9,9 | 6,4 |
| 2017.10 | 252 | -18% | 88 | 2,9 | 6 | 8,8 | 7,0 |
| 2018.01 | 233 | -8% | 97 | 2,4 | 5 | 9,1 | 6,7 |
| 2018.04 | 254 | 9% | 115 | 2,2 | 1 | 8,5 | 8,5 |
| 2018.07 | 334 | 31% | 121 | 2,8 | 3 | 9,8 | 7,8 |
| average | 150,6 | 3,2 | 6,1 | 8,8 | 6,3 | ||
Source: https://www.oracle.com/technetwork/topics/security/alerts-086861.html
Deutsche Übersetzung dieses Posts
Ad (Amazon Link):